This blog contains information on how to performance test SharePoint 20102013, to benchmark the load the SharePoint farm is under.
Web Performance load testing:
These tools are used to create web test scenarios which then can be load tested with virtual users, usual these tools will provide information such as response times, failed pages, hits, bandwidth and user count.
| Web Performance Pro http://www.webperformance.com/ | 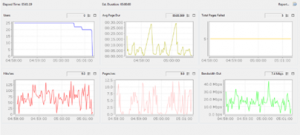 |
| Visual Studio Ultimate with MSDN http://www.microsoft.com/visualstudio/eng/products/visual-studio-ultimate-2012 | 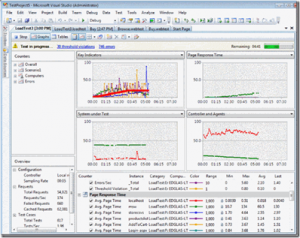 |
Web Log Analysing Tools
These are used to review the IIS web logs, providing information such as page views, hits, connected users, location of users and RPS
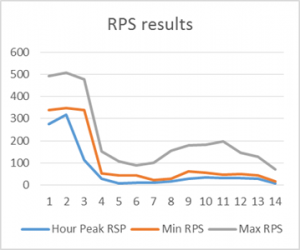
| IIS Log Parser 2.2 http://www.microsoft.com/en-us/download/details.aspx?id=24659This is a command tool which extracts information into CSV files for manipulation in excel.
This tool will provide RPS results and Page Views
Usage with SharePoint http://www.microsoft.com/downloads/details.aspx?familyid=f159af68-c3a3-413c-a3f7-2e0be6d5532e&displaylang=en&tm |
 |
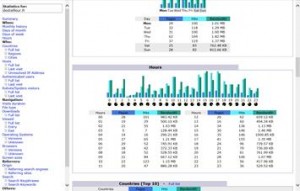
| AWSTATS http://awstats.sourceforge.net/This is a web based tool
This tool will only provide Hourly page view and hits rather than RPS and page viewsec |
 |
Performance Monitor
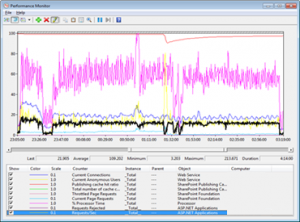
Performance monitor is used to capture the performance state of the system whilst the performance tests are running, this allows us to understand what load the servers are under and helps us to understand the limits of the environment and when the farm should be increased.
Results
Using the information gathered from the tools above we can then gather the test information and align to the optimal performance zones into Green and Red zone limits.
Typically you would want to fall within the Green Zone and only the Red Zone when the traffic generated is unexpected
| Green Zone | Red Zone | ||
| Web Server | CPU <60% averagePage Response <1000ms for 75% | CPU <80%Page Response <3000ms for 75%No 500 errors
0.1% page failure rate |
|
| Concurrent Users(test tool) | Number of concurrent users running a scenario test | ||
| Processor%Processor time_total(performance monitor) | The % Processor Time counter measures the percentage of elapsed time that the processor spends to execute a non-Idle thread | ||
| Memory AvailableMemoryAvailable Mbytes(Performance Monitor)
|
Available MBytes counter to measure the amount of physical memory in MB immediately available for allocation to a process or for system use | ||
| Page Response Times(test tool) | Time in milliseconds to return a page | ||
| Request Per Second(test tool and IIS logs) | Number of requests the farm is performing in a second | ||
| Page views Per Second(test tool) | Number of pages return in a second | ||
| Database Server | CPU <50% | CPU <80% | |
| Processor%Processor time_total(performance monitor) | The % Processor Time counter measures the percentage of elapsed time that the processor spends to execute a non-Idle thread | ||
| PhysicalDiskDisk Read/sec_Total(Performance monitor) | Number of disk reads per second | ||
| PhysicalDiskDisk Write/sec_Total(performance monitor) | Number of disk writes per second | ||
| Physical Disk IOPS | Adding both readwrite per second = IOPS |
Analysis Tools
PAL Download: http://pal.codeplex.com/releases/view/51623, Documentation: http://pal.codeplex.com/
One thought on “SharePoint Performance testing (Counters, IIS Logs, Load, Senario)”